
Software
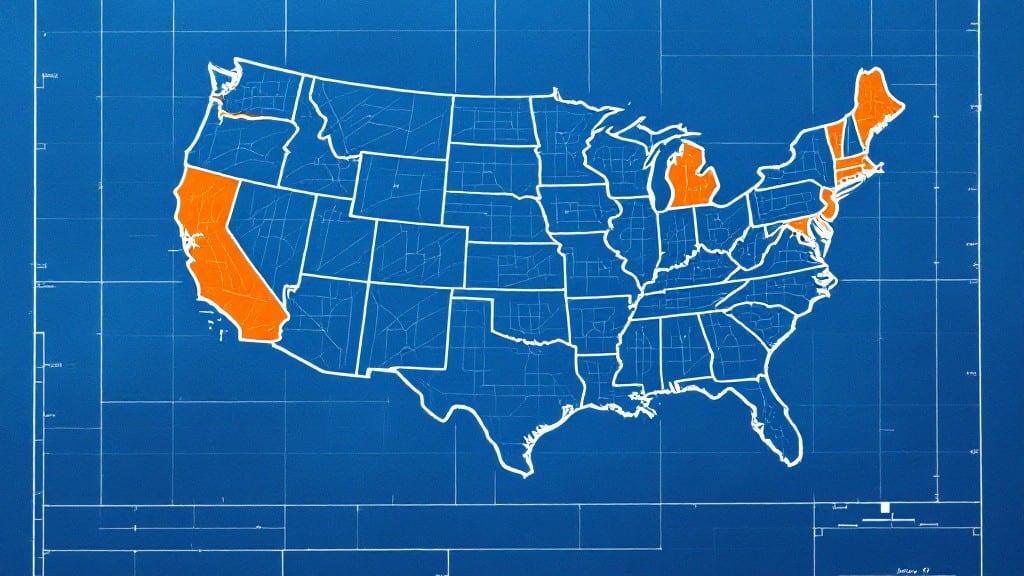
Organizing U.S. states by region in Excel cuts down on data entry errors and speeds up regional analysis for projects.
Need a quick, accurate way to reference U.S. states by region for presentations, data analysis, or educational projects? A well-organized Excel map template can save hours of manual work and ensure consistency—whether you're a teacher, analyst, or business professional.
Below, I’ll walk you through building a dynamic template with dropdown menus, color-coded regions, and even a free downloadable version to get you started in minutes.
How to create a U.s. states by region map in Excel (step-by-step guide)
Creating a U.S. states by region map in Excel transforms static data into an interactive tool. Whether you're a teacher planning lessons, a data analyst tracking regional trends, or a business professional organizing sales territories, this template will save time and reduce errors.
The key is using conditional formatting, dropdown menus, and color-coding to dynamically highlight regions.
Start by opening a new Excel workbook and naming the first sheet "U.S. States by Region." This will serve as your data hub. The goal is to build a template where users can filter states by region with a single click.
For example, selecting "South" should instantly highlight all Southern states in your visualization.
Before diving into formulas, gather your data. You’ll need three columns: State Name, Region, and Optional Data (like population or abbreviation). For regions, use these standard groupings: Northeast, Midwest, South, and West. This ensures consistency across presentations or reports.
Now, let’s structure your sheet. In Cell A1, type "State," B1 as "Region," and C1 as "Abbreviation."
Below these headers, list all 50 states in column A, their regions in column B, and abbreviations in column C. For example, "California" in A2, "West" in B2, and "CA" in C2.
To make your map interactive, add a dropdown menu for region filtering. In Cell E1, type "Filter by Region."
In E2, create a dropdown using Data Validation (go to Data > Data Validation > List) with these options: Northeast, Midwest, South, West, and All.
Next, apply conditional formatting to color-code states by region. Select the range A2:C51 (assuming 50 states), then go to Home > Conditional Formatting > New Rule.
Choose "Use a formula" and enter: =$B2="Northeast" Set the fill color to #6B46C1 (purple), then add rules for each region with distinct colors (e.g., #002a6d for Midwest, #ffcc00 for South, #009900 for West).
To filter dynamically, insert a table (select your data range > Insert > Table). Name it "StatesTable."
In Cell E4, use this formula to filter visible states: =FILTER(StatesTable, StatesTable[Region]=E$2) If E2 is "All," use: =StatesTable This will display all states when no region is selected.
For a visual map, insert a shapes-based U.S. outline (download a free SVG or use Insert > Shapes > New Drawing Canvas). Place states as labels or use VLOOKUP to link data to shapes.
For example, in Cell D2, use: =VLOOKUP(A2, StatesTable, 3, FALSE) This pulls the abbreviation to label states on your map.
Save your template as a .xltx file (Excel Template) for reuse. Now, every time you open it, you’ll have a ready-to-use U.S. states by region map with dropdown filters and color-coded regions. Share it with colleagues or embed it in presentations for instant clarity.
Step-by-Step Guide to Building Your Template
- Set Up Your Data: Create columns for State, Region, and Abbreviation. Populate with all 50 states and their regions.
- Add a Dropdown Menu: Use Data Validation in Cell E2 to create a filter for Northeast, Midwest, South, West, and All.
- Apply Conditional Formatting: Color-code rows based on region using formulas like
=$B2="Northeast"with distinct colors for each region. - Convert to a Table: Select your data range and insert a table named "StatesTable" for dynamic filtering.
- Create a Filter Formula: In Cell E4, use
=FILTER(StatesTable, StatesTable[Region]=E$2)to display only selected states. - Design Your Map: Insert a U.S. outline and label states using VLOOKUP to pull abbreviations from your data.
- Save as a Template: Export as .xltx to reuse the template with fresh data.
Pro tip: Use Power Query to automate data updates. Import a CSV of state data (e.g., from the U.S. Census Bureau) and refresh it monthly to keep your map current. This is especially useful for tracking regional trends like population growth or sales metrics.
For advanced users, consider adding a slicer (go to Insert > Slicer) to let users interact with the map visually. This adds a layer of interactivity without complex formulas. Test your template by filtering regions and verifying that only the correct states appear in your visualization.
With this U.S. states by region map, you’ll eliminate manual errors and save hours of setup time. Whether you're teaching geography, analyzing market data, or planning a cross-country project, this template keeps your work organized, professional, and dynamic. 🖥️
Free downloadable Excel templates: best pre-made U.s. State region maps
If you're short on time but still need a professional-grade U.S. state region map in Excel, pre-made templates are a game-changer. These templates eliminate manual formatting while ensuring accuracy and consistency across all four U.S. census regions.
Whether you're preparing for a business report or a classroom lesson, these ready-to-use files integrate seamlessly with Excel 2016 and Excel 365, saving you hours of setup.
Below, I’ve curated the top free templates—each offering unique features like interactive dropdowns, color-coded regions, and data validation—so you can pick the one that fits your workflow. For advanced users, I’ve also included a DIY template guide to customize your own map with minimal effort.
| Template Name | Source | Excel Version | Key Features | Download Link |
|---|---|---|---|---|
| U.S. States by Region Map | Vertex42 | 2016/365 | Color-coded regions, dropdown menus, data validation | Download Here |
| U.S. Census Regions Map | Microsoft Office Templates | 365 | Interactive filters, pivot-ready data, conditional formatting | Download Here |
| DIY U.S. States Template | Excel Easy | 2016/365 | Customizable regions, VBA macros for automation | Download Here |
For users who prefer full control, the DIY template from Excel Easy lets you tweak regions, add custom data fields, or even integrate VBA macros for automation. This is ideal if you need to align the map with specific business or educational criteria.
For example, you could add columns for population density or economic indicators to enhance your analysis.
Before downloading, check your Excel version compatibility. Most templates work flawlessly with Excel 2016 and Excel 365, but some advanced features (like interactive filters) may require Excel 365’s newer functions. Always test a template in a backup file first to avoid disrupting your existing projects.
Need to embed this map in a PowerPoint or Google Slides? All these templates support copy-paste compatibility, so you can drag and drop the map directly into your presentations. For added flair, use conditional formatting to highlight states based on custom criteria, like sales performance or demographic trends.
Pro tip: Bookmark these templates in your Excel template library for quick access. Over time, you’ll build a personalized collection tailored to your workflow needs, from regional sales tracking to educational geography lessons. 🖥️